Gini Definition
Definition:
The Gini coefficient is a measure of inequality developed by the Italian statistician Corrado Gini and published in 1912. It is usually used to measure income inequality, but can be used to measure any form of uneven distribution. The Gini coefficient is a number between 0 and 1, where 0 corresponds with perfect equality (where everyone has the same income) and 1 corresponds with perfect inequality (where one person has all the income, and everyone else has zero income). The Gini index is the Gini coefficient expressed in percentage form, and is equal to the Gini coefficient multiplied by 100.
While the Gini coefficient is mostly used to measure income inequality, it can also be used to measure wealth inequality.
It is an interesting fact that while the most developed European nations tend to have income inequality values between 0.24 and 0.36, the United States has been above 0.4 for two decades, showing the United States has a greater inequality (and that this is not just a recent development).
Calculation:
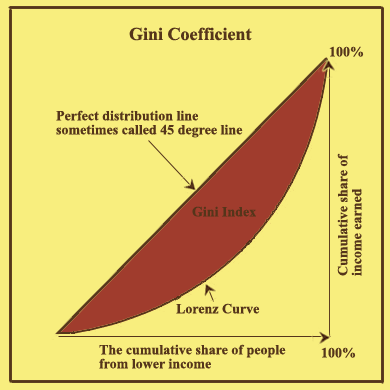
The Gini coefficient is calculated as a ratio of the areas on the Lorenz curve diagram. If the area between the line of perfect equality and Lorenz curve is A, and the area underneath the Lorenz curve is B, then the Gini coefficient is A/(A+B). This ratio is expressed as a percentage or as the numerical equivalent of that percentage, which is always a number between 0 and 1.

Advantages
- The Gini coefficient's main advantage is that it is a measure of inequality, not a measure of average income or some other variable which is unrepresentative of most of the population.
- Gini coefficients can be used to compare income distributions across different population sectors as well as countries, for example the Gini coefficient for urban areas differs from that of rural areas in many countries.
- The Gini coefficient is sufficiently simple that it can be compared across countries and be easily interpreted. GDP statistics are often criticized as they do not represent changes for the whole population, the Gini coefficient demonstrates how income has changed for poor and rich. If the Gini coefficient is rising as well as GDP, poverty may not be improving for the vast majority of the population.
- The Gini coefficient can be used to indicate how the distribution of income has changed within a country over a period of time, thus it is possible to see if inequality is increasing or decreasing.
- The Gini coefficient satisfies four important principles; Anonymity, it doesn't matter who the high and low earners are. Scale independence, the Gini coefficient does not consider the size of the economy, the way it is measured, or whether it is a rich or poor country on average. Population independence, it does not matter how large the population of the country is. Transfer principle. This states that if we transfer income from a rich person to a poor person, the resulting distribution is more equal.
Disadvantages
- There is an implication built into the Gini coefficient that a straight-line distribution is a desirable outcome, which in the newly evolving long tail economics (where rich people are very rich) may not be the case.
- Comparing income distributions among countries may be difficult because benefits systems may be different in different countries. For example, some countries give benefits in the form of money, others use food stamps, which may or may not be counted as income in the Lorenz curve and therefore not taken into account in the Gini coefficient.
- The Lorenz curve may understate the actual amount of inequality if the situation is that richer households are able to use income more wisely than lower income households. From another point of view, however, the measured inequality also may be the result of more or less wise use of household incomes.
- As with all statistics, when collecting the income data initially, there will always be systematic and random errors. If the data is less accurate, then the Gini coefficient has less meaning. Also, countries may measure the statistics differently, thus it is not always possible to compare statistics between countries.
- Economies with similar incomes and Gini coefficients can still have very different income distributions. This is because the Lorenz curves can have different shapes and yet still yield the same Gini coefficient.
- It is claimed that the Gini coefficient is more sensitive to the income of the middle classes than to that of the extremes.
- Too often only the Gini coefficient is quoted without describing the proportions of the quantiles used for measurement. As with other inequality coefficients, the Gini coefficient is influenced by the granularity of the measurements. Example: Five 20% quantiles (low granularity) will yield a lower Gini coefficient than twenty 5% quantiles (high granularity).
